
วันนี้จะเอาตัวอย่างงานเขียนของนักเรียนท่านหนึ่งมาให้ดูกันครับ
น้องคนนี้มีพื้นฐานภาษาอังกฤษระดับกลางๆ เเต่ความตั้งใจเเละความมุ่งมั่นต้องบอกว่าระดับสูงเลยครับ
เราลองมาดูงานเขียนของน้องเลยดีกว่าครับ
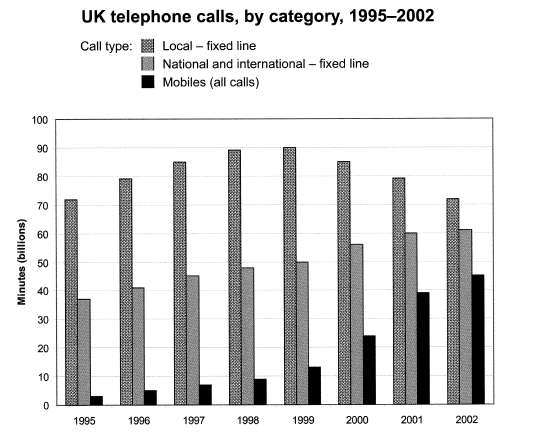
โจทย์ : The chart below shows the total number of minutes (in billions) of telephone calls in the UK, divided into three categories, from 1995-2002.
The bar chart illustrates the total figures for minutes of telephone calls in the United Kingdom, distinguished into three different types over an 8-year period between 1995 and 2002. Looking more closely at the trend for the charts, it can be seen that an upward trend is observed for all charts, while a fluctuating trend is seen for the bar chart for the total minutes of local call.
According to the chart, local call was the most popular among British people over the whole period. There was a fluctuation at around 70 billion minutes from 1995 to 2002. In addition, national and international call maintained a middle position. The figures revealed a gradual increase from about 39 billion minutes to nearly 60 billion minutes between 1995 and 2002. Moreover, British people used mobile phones the least in 1995. Nonetheless, the minutes spent on mobiles depicted a dramatic growth by almost 30 billion minutes from 1995 to 2002, representing the biggest change of all call types.
In conclusion, mobile phone calls were the least popular, whereas the local calls were made the most among Britain people.
ลองเอาไปดูเป็นไอเดียในการเตรียมตัวสอบครับ ถ้าเขียนได้เเบบนี้ เอา BAND 7.5 ของ Task 1 ไปเลยครับ
น้องคนนี้มีพื้นฐานภาษาอังกฤษระดับกลางๆ เเต่ความตั้งใจเเละความมุ่งมั่นต้องบอกว่าระดับสูงเลยครับ
เราลองมาดูงานเขียนของน้องเลยดีกว่าครับ
โจทย์ : The chart below shows the total number of minutes (in billions) of telephone calls in the UK, divided into three categories, from 1995-2002.
The bar chart illustrates the total figures for minutes of telephone calls in the United Kingdom, distinguished into three different types over an 8-year period between 1995 and 2002. Looking more closely at the trend for the charts, it can be seen that an upward trend is observed for all charts, while a fluctuating trend is seen for the bar chart for the total minutes of local call.
According to the chart, local call was the most popular among British people over the whole period. There was a fluctuation at around 70 billion minutes from 1995 to 2002. In addition, national and international call maintained a middle position. The figures revealed a gradual increase from about 39 billion minutes to nearly 60 billion minutes between 1995 and 2002. Moreover, British people used mobile phones the least in 1995. Nonetheless, the minutes spent on mobiles depicted a dramatic growth by almost 30 billion minutes from 1995 to 2002, representing the biggest change of all call types.
In conclusion, mobile phone calls were the least popular, whereas the local calls were made the most among Britain people.
ลองเอาไปดูเป็นไอเดียในการเตรียมตัวสอบครับ ถ้าเขียนได้เเบบนี้ เอา BAND 7.5 ของ Task 1 ไปเลยครับ