
วันก่อนได้มีการเเชร์งานเขียนโจทย์ Bar Chart ของน้องนักเรียนไปแล้ว วันนี้จะเอาตัวอย่างของการเขียนแบบ Line Graph มาให้ดูครับ ว่างานเขียนที่ดีควรจะเป็นอย่างไร งานเขียนชิ้นนี้ทำได้ค่อนข้างดีในทั้งส่วนของ Language เเละ Content
สำหรับส่วน Language นั้นเป็นเพราะมีการใช้ Structure ที่เเตกต่างกันในการเขียน เช่น
1.The number of Japan remained constant at approximately 3.8% until 1995
2.There was a gradual fall in the US unemployment rate from 6% in 1994 to about 5.1% in 1999
3.The rate in the US went down gradually from 7% to just 6% during the same period.
สังเกตว่าผู้เขียนใช้ 3 รูปแบบการเขียนในการสื่อสิ่งๆเดียวกัน มากไปกว่านั้นมีการใช้ Vocabulary ที่เหมาะสมเเละหลากหลาย ในส่วนของ Grammar ก็มีการใช้ Past Tense ซึ่งถูกต้องสำหรับโจทย์ข้อนี้ ซึ่งสิ่งเหล่านี้จะเป็นสิ่งที่อธิบายว่าทำไมบางคนเขียน Content(Task Fulfillment) ถูกเเต่ได้คะเเนนไม่เกิน 5.5 ในพาร์ท Writing
สำหรับ Task Fulfillment นั้น มีการเปรียบเทียบข้อมูลของเเต่ละกราฟในระหว่างการเขียน เเละมีการพูดถึงจุดสำคัญๆของเเต่ละกราฟ
ทำให้งานเขียนชิ้นนี้สามารถทำคะเเนนได้ Band 7.0-7.5 สำหรับ Task 1 อย่างไม่มีปัญหาครับ อธิบายมาขนาดนี้ เรามาดูงานเขียนจริงของน้องดีกว่าครับ
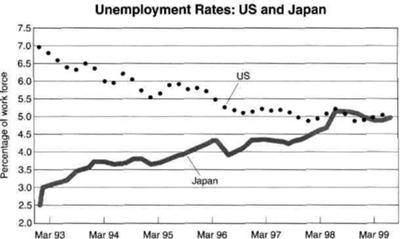
โจทย์: THE GRAPH SHOWS THE UNEMPLOYMENT RATES IN THE US AND JAPAN BETWEEN MARCH 1993 AND MARCH 1999.
The line graph illustrates the rates of unemployment in both US and Japan over a seven-year period from 1993 to 1999. Looking more closely at the trend for the line graph, it can be seen that an upward and a downward trend are observed for Japan’s rates and US’ respectively.
According to the rate for Japan, the figure increased gradually from 2.5% to about 3.8% between 1993 and 1994. However, the rate in the US went down gradually from 7% to just 6% during the same period. Moreover, the number of Japan remained constant at approximately 3.8% until 1995. Rate of unemployment in Japan then depicted a gradual rise to 5% in 1995. Meanwhile, there was a gradual fall in the US unemployment rate from 6% in 1994 to about 5.1% in 1999 and these numbers intercepted with the rate in Japan.
In conclusion, it was noticeable that both the US and Japan unemployment rates came closer gradually over a period and eventually the rates for both countries are nearly at the same level in the year 1999.(179 words)